
G-Accon is introducing the Tableau BI solution for G-Accon users. G-Accon users will have the ability not only generate their financial reports in Google spreadsheet, but create visual reports. G-Accon Xero and QuickBooks customers will be using Tableau software which is a data visualization tool used for data science and business intelligence. With G-Accon and Tableau auto refresh, you have the ability to build Real Time Dashboard.
Here is how it works.
In order to pull Xero and QuickBooks Reports, first of all you need to download the Tableau software from Tableau website. It can be 14 days trial version or free Tableau Public.
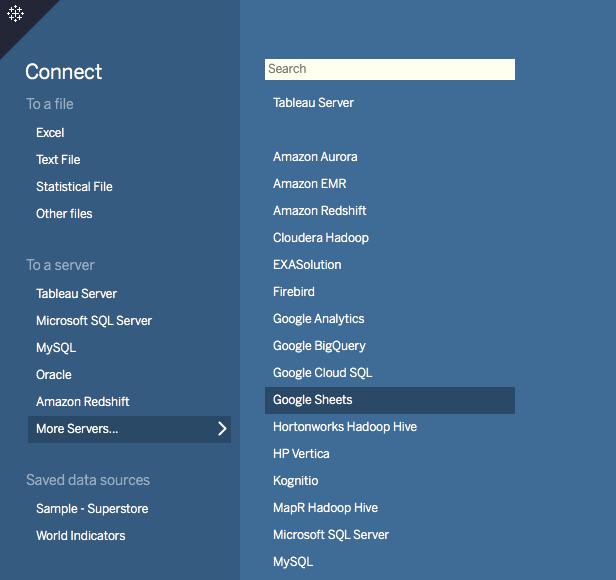
Next step, you need to open the installed Tableau software and select Connect. Then you need to choose “More Server” which is under “To a server” option of the Connect menu; and select Google Sheets:
In the new tab Tableau opens in your default browser, you need to do the following:
- Sign in to Google Sheets using your email or phone, and then select Next to enter your password. If multiple accounts are listed, select the account that has the Google Sheets data you want to access and enter the password, if you’re not already signed in.
- Select Allow so that Tableau Desktop can access your Google Sheets data.

- Close the browser window when notified to do so.
- Select your G-Accon for Xero or G-Accon for QuickBooks Google Sheet from the list or use the text box to search for a specific Google Sheet by name or by URL, and then click on the Connect button.

The Select Your Google Sheet dialog box includes the following:
- The list of google sheets that you can select from includes your private sheets, sheets shared with you, and the public sheets that you’ve accessed in the past.
- If you search by URL and the URL doesn’t exist or you don’t have access to it, an error displays.
- You can select the Name and Last Opened By Me column names to sort the Google Sheets, and when you select a sheet you can preview it in the right pane. You cannot sort by Owned By.
- If you have many Google Sheets and want to find a particular sheet, you can use the search bar to narrow the results.
After you click on the “Connect” button, you will see the following screen.

Work with G-Accon Google Spreadsheet
In order to see the graph representation, you need to select a report from the “Sheets” category and drag it to the main area.

After you drop the G-Accon Google Sheet in the designated area, you should see your data has been moved to Tableau table.

This is the original G-Accon for Xero Google Sheet:

Now you can use Tableau application to visually represent your financial (Xero/QuickBooks) data.


Connect to more data
You also have the ability to connect to more than one table by using join in Tableau.

You can review G-Accon for Tableau documentations in our web site at: https://wiki.accon.services/tableau/
