
In your cloud-based financial and business management, every second counts. That’s where automation steps in, reshaping traditional manual processes. This time, G-Accon brings another trailblazer feature to help you – the KPI Dashboards.
Since 2017, we’ve been a leading cloud-based application that integrates Google Sheets with various Cloud accounting software. Over 17,000 businesses in more than 60 different countries already trust G-Accon to assist them with their financial data.
At G-Accon, we are passionate about simplifying data-driven decision-making without compromising. That’s why G-Accon has recently been named one of the Top Accounting Apps for 2023 by Accounting Today. Thanks to our partnership work, we also received the Xero Emerging App Partner of the Year Award in 2018.
Because we’re next-level experts at facilitating seamless automation, let’s determine how accurate financial reporting and analysis shouldn’t be a dilemma. In this blog, you’ll find an introduction to what the KPI Dashboard release is plus its features and implementation. It’ll be followed by a comprehensive guide to its customization with a final section addressing the most frequently asked questions.
Introducing KPI Dashboards: A Step-by-Step Guide
Only a few weeks ago, we introduced the Business Overview Reports feature. Now, the newly implemented built-in package, the KPI Dashboards, comes in to boost your reporting and designing. These are a series of pre-designed templates to automate and customize your data to make more informed decisions.
G-Accon’s KPI Dashboards, integrated into the Business Overview Reports, make this vision a reality. Let’s embark on a step-by-step journey to unlock the full potential of this revolutionary tool.
If you’re interested in using our KPI dashboards, simply download the package from the following link. You can also email support@accon.services if you have any questions.
The first step in using the KPI reports and graphs design dashboard is to make a copy of the file. Because, at first, you’ll get a view-only file. Once you’ve created your usable version of the dashboard, begin with the data contained within our demo file, or “Dummy Data”.
Tailoring Dashboards to Your Needs
Now comes the fun part. You must pull and replace this data with your client data. Take a look at our four recommendations on how to successfully run your new templates:
1. Load the Cloud Templates: Go to G-Accon Extension for QuickBooks, select Load Cloud Template, and then select the G-Accon Cloud template Library. Eight reports await your exploration.
2. Execute and Update all the Reports: These need to be downloaded, applied in a certain order, and executed. Start with the Profit and Loss Report. The next step that you will do is follow the same procedure for the rest of the eight tabs. Execute them without modifications, maintaining the same specified order for all reports.
3. Customizing Date Ranges: Seamlessly adjust the set-up date ranges for all reports at once within the Dates tab. A small yet powerful feature for a clearer view of client data.
Important: Note that the last tab, the Total Data tab, is very important. This query with formulas allows us to build the dashboard for you in tab number two. Please, don’t delete or modify this tab as it’s essential to make sure that your dashboard’s data is accurate.
4. Dashboard Building: Move to the second tab, where formulas come to life. Apply the templates and your fully functional dashboard will be ready, requiring only a logo change. In tab number one, the company profile and details will automatically update. The only task you have to change is the company logo to your respective logo or client logo.
Streamlining Dashboard Updates
Your next step in customizing this dashboard is automation. This is the key part of the process. To do that, follow these three simple suggestions:
- Automation and Workflow Creation: Navigate to the G-Accon extension, select “Automation,” and create a workflow. Add your templates and name your workflow. You can optionally add a description for clarity too.
- Configuration of the Settings: Use the Scheduler tab to choose how often your templates refresh. Specify the time and decide if you want a log of operations generated. Upon refresh, you can always decide whether to receive email notifications and alerts.
- Finally, “Apply and Execute” to finalize the automation setup. Your dashboard will now update automatically, freeing you from manual interventions.
For those looking for some extra customization, we recommend hiding sheets that don’t need to be displayed to clients, like the summary sheets. To do this, go to the Dashboard tabs and review your tabs at the bottom, such as Profit and Loss. In this context, we advise to focus on tabs containing detailed reports to be shown to clients
In a nutshell, our pre-designed templates feature default styles, fonts, and layouts but these can be easily customized to meet your customers’ expectations. This set of reports will be a valuable tool for easy-to-manage key financial metrics management to help you make informed decisions.
For a more in-depth demonstration of these steps, we invite you to watch our 10-minute video explanation in which our team member Sonia Yazdi illustrates the package implementation.
From Inventory Management to Precise Financial Reporting for Fractional CFO Firms
Recently, we delivered an insightful webinar with a Live Q&A, where Andrew Forte, a certified G-Accon partner and the mind behind DataNow.Guru, shared his takeaways when implementing the KPI Dashboards in his business.
His G-Accon journey started with “inventory management, pulling live inventory data from Xero into Google Sheets, and updating every hour,” he said. This small need led him to “discover its incredible potential,” he confirmed.
DataNow.Guru’s most popular service is building out G-Accon reports for fractional CFO firms. According to him:
“I think that not a single day has passed in the last seven years when I haven’t used G-Accon. The possibilities with G-Accon and Sheets are almost unlimited. And I think that’s the main benefit of G-Accon. I know a lot of CFOs out there struggle with whether they should use Fathom or Syft, or whether they should use any mainstream reporting software. However, you’re never going to achieve the granularity that you can with G-Accon.”
– Andrew Forte, Founder & CEO of DataNow.Guru.
During the webinar, he did a demonstration with different dashboards that are possible within G-Accon. Andrew showcased G-Accon’s versatility, presenting diverse dashboards from simple one-page reports to detailed financial statements. Let’s have a look at his highlights.
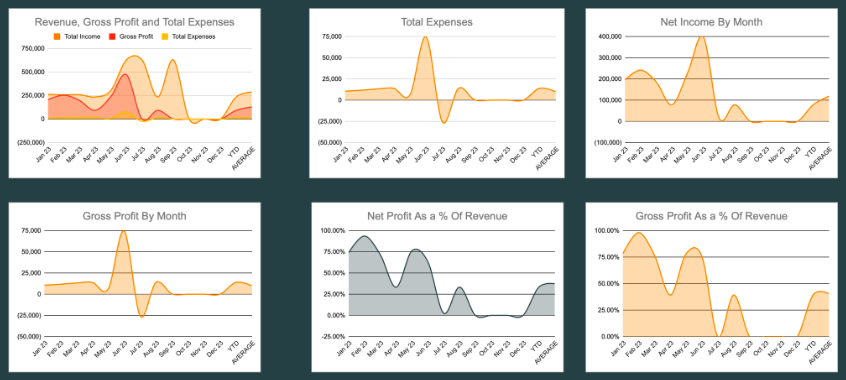
Turning Dummy Data Into Dynamic Dashboards
Andrew emphasized G-Accon’s “unparalleled granularity”. It allows you “to analyze and find specific details that matter to your business,” he mentioned. He also highlighted that “it enables you to see everything from your accounting system in a single spreadsheet, making it convenient for investors and business owners”.
His main insights on bringing dashboards to life with dynamic data were:
- Accessibility and Convenience: The platform’s accessibility through Google Sheets makes it user-friendly for clients, investors, and business owners.
- Customization and Automation: Having the flexibility to create both simple and detailed dashboards without constant updates. Andrew demonstrated the ability to customize colors, fonts, and formatting to match individual aesthetic preferences.
- Formula Fundamentals: Addressing the potential challenges with traditional formula approaches is key. Users can apply query formulas as dynamic solutions to avoid errors and misrepresentations.
- Dynamic Data Handling: Obtaining ever-changing but steady financial reports, including Profit and Loss and Balance Sheet, which can change daily based on client activities.
- Scaling Efficiency: Applying templates across multiple entities while also delivering efficiency in financial reporting thanks to streamlining data parameters and a simple loading process.
Listen to Andrew from DataNow.guru enumerating the benefits of using G-Accon as their daily tool for the past 7 years:
Without further ado, here you have the Q&A section from our KPI DashboardsDesign live webinar.
Addressing Your Questions on the KPI Dashboards Package
During our webinar, we gathered and answered your most pressing questions. Let’s delve into the insights:
1. Are there any plans for a G-Accon and NetSuite Integration?
No. Currently, there are no plans for a NetSuite integration. G-Accon focuses on enhancing integration between Xero/QuickBooks and MS 365.
2. Where can I access the KPI’s Masterclass recordings?
The recording is available on G-Accon’s YouTube channel for comprehensive revisits. If you don’t want to miss all the highlights, watch the full webinar by clicking here.
3. Do you have an integration with Microsoft Excel?
Our emphasis is on integrating Xero/QuickBooks with MS 365 in the future.
4. When will the Dashboard Templates be shared?
The dashboard templates are readily available here.
5. Are there any Templates in the Library?
Find templates in the “Cloud Template Library” by searching for “KPI”. Specifically, there are 8 templates available to build the dashboards.
6. What about the Templates for QBO Users?
There are 5 KPI dashboard versions for QuickBooks users and one version for Xero users, accessible here.
7. Is it possible to get a mobile-friendly view?
For optimal mobile viewing, exporting the dashboard as a PDF is recommended.
8. Difference Between Balance Sheet and Balance Sheet Report:
While the Balance Sheet is a required report offering a summary, the Balance Sheet Report provides style options for client presentations.
9. If a developer wanted to collaborate with the G-Accon team, who would they contact?
Developers can reach out to support@accon.services for collaboration inquiries.
10. What to do about the Balance Sheet integration with Xero situation? It only allows it to pull 12 months at a time.
Overcome the 12-month limitation by creating multiple templates with different date ranges, as demonstrated here.
11. Is there any availability of Budget vs Actual Reports?
Yes. Find Budget vs Actual and Budget Variance reports under Custom Accounting Reports and Business Overview.
12. How do I pull a Balance Sheet?
Pulling a Balance Sheet is conveniently done from the Get Accounting Data/Reports menu option. A detailed guide is available here.
13. Are there any detailed Sales Analysis Reports available?
Yes. G-Accon offers various reports like Sales Details, Sales by Customer, and Sales by Product and Services.
14. Will adding Tabs have an impact on the Dashboard Template?
Adding tabs won’t adversely affect the existing dashboard.
15. Do you have a KPI Template for Accounts Receivable/Accounts Payable?
Not yet. G-Accon eventually will add the additional templates for both Accounts Receivable and Accounts Payable.
16. Is there a G-Accon Community Forum?
Join the Facebook G-Accon users group for community discussions. Join us here.
17. What’s the best way to grasp the basics of G-Accon?
We suggest starting with the QuickStart guide and attending weekly webinars for a solid foundation.
18. How would you use this template to consolidate multiple QBO companies?
While no specific KPI dashboards for multiple QBO companies exist, explore consolidation options in this tutorial.
Redefined Financial Reporting Precision With G-Accon’s KPI Dashboards
As you know, when it comes to financial data, misrepresentations can lead to serious consequences. Understanding the importance of effectively utilizing real-time data through G-Accon will save efforts and expenses. G-Accon will lend a hand to help you manage your data and pull it effectively. It’s live, in real-time, and as simple as it can get.
G-Accon’s KPI Dashboards are the gateways to unlock improved financial insights. We aim to guide you through the seamless integration, customization, and practicality of these dashboards. By exploring our KPI templates and accessing G-Accon’s community and support resources, we’re sure to elevate your financial analytics game.
Stay tuned for more exciting sessions empowering your financial data. Until then, let G-Accon be your guide in the world of data mastery.
Any questions? Let us know your suggestions by shooting an email to support@accon.services.
This is financial clarity made easy. This is G-Accon.

Comments are closed.